Following the Solar Upgrade Solis 1.5kW inverter and Raspberry Pi RS485 Logging blog post, the house’s front roof has been replaced with new insulation and slates. We have installed the new solar rails and panels to the home.
Our original plan was to install five JA Solar 340W Mono panels, but after ordering these, we were told they were unavailable. After a few days, the supplier was about to source 330W panels, which are the same dimensions.
The roofers installed the new stainless-steel brackets into the rafters and fitted the waterproof flashings around the brackets to seal the roof.
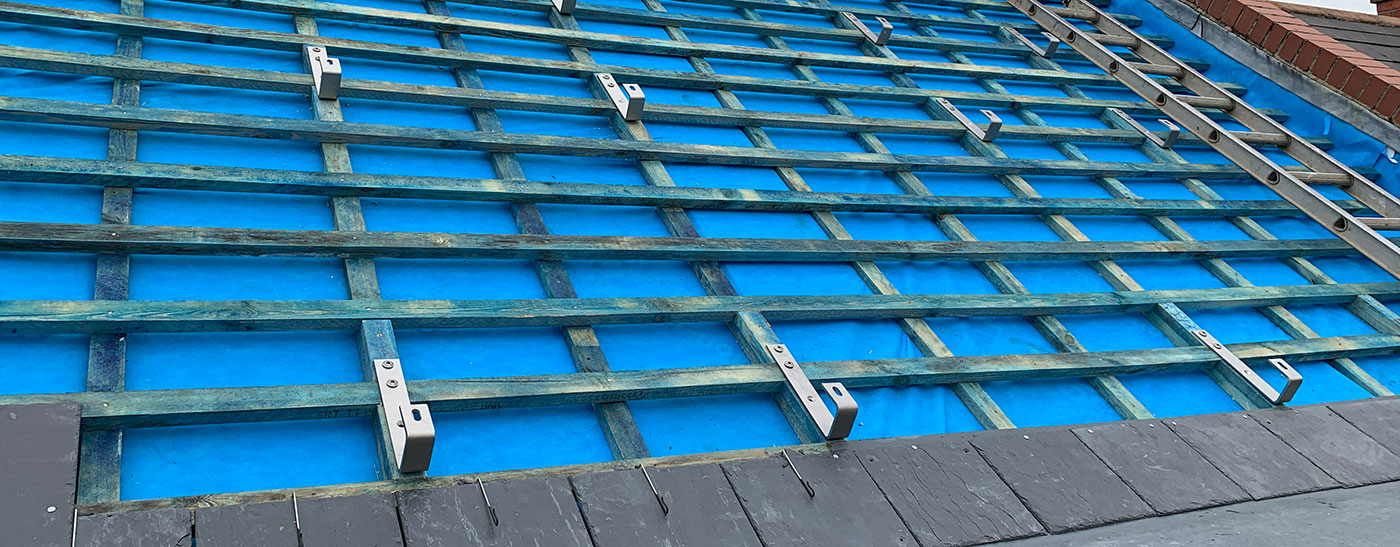
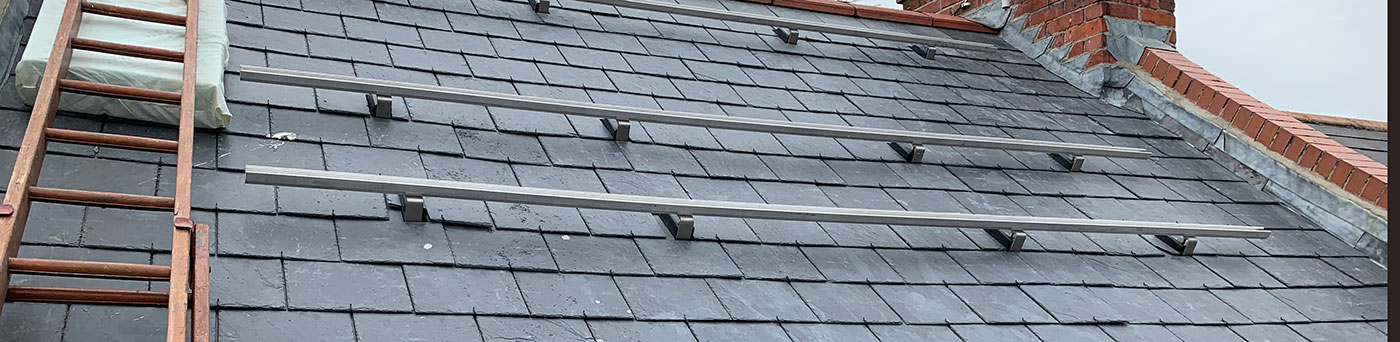
The roof rails are fitted using M8 bolts, clamping into the bottom of the rails, and the solar panel brackets fit into slots on the top.
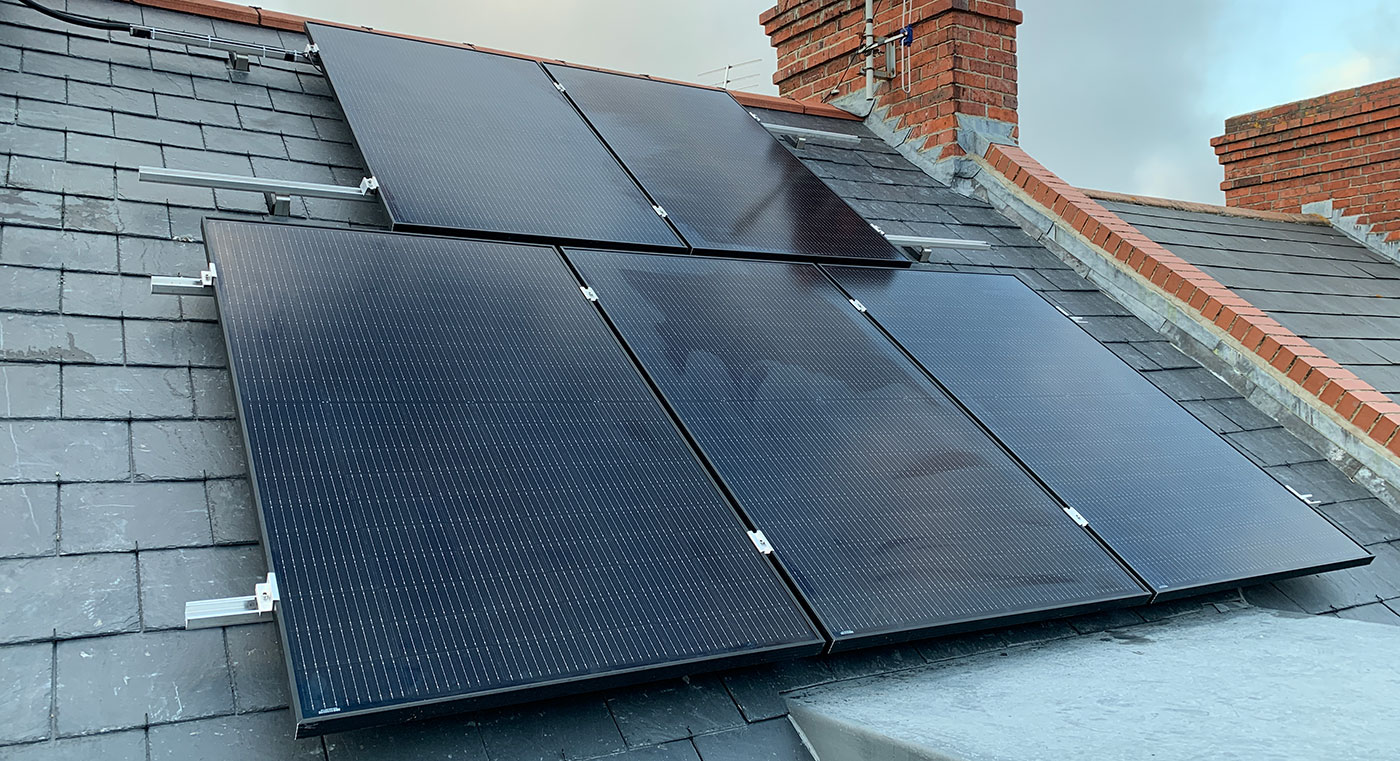
The new panels measure 1689 x 996 x 35mm, and we fitted these onto 3.3-meter rails with 2 on the top row and 3 below, which will give us a theoretical maximum output of 1.6kW, which is suitable for the Solis Solar 1.5kW Mini 5G Inverter.
To make the installation of the panels more manageable, we fitted lengths of angle aluminium to each panel into existing mounting holes so the panels could rest over the rails and not slide down before the panel mounts were fitted. This also made lifting the panels to the roof and into the rails easier, as we could use a rope to lift them to the scaffolding.
Solar Power Generation
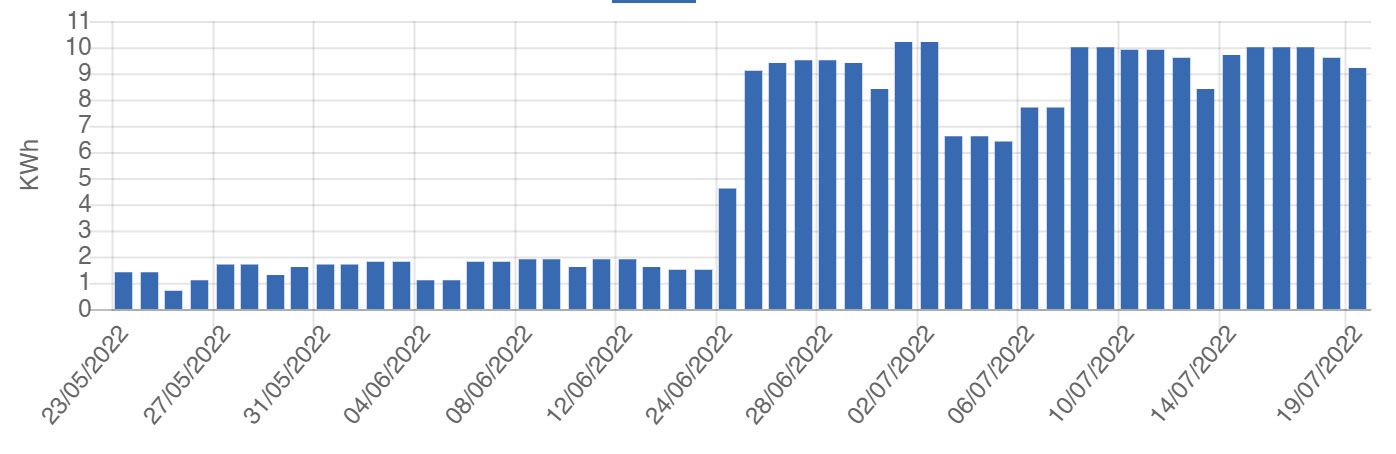
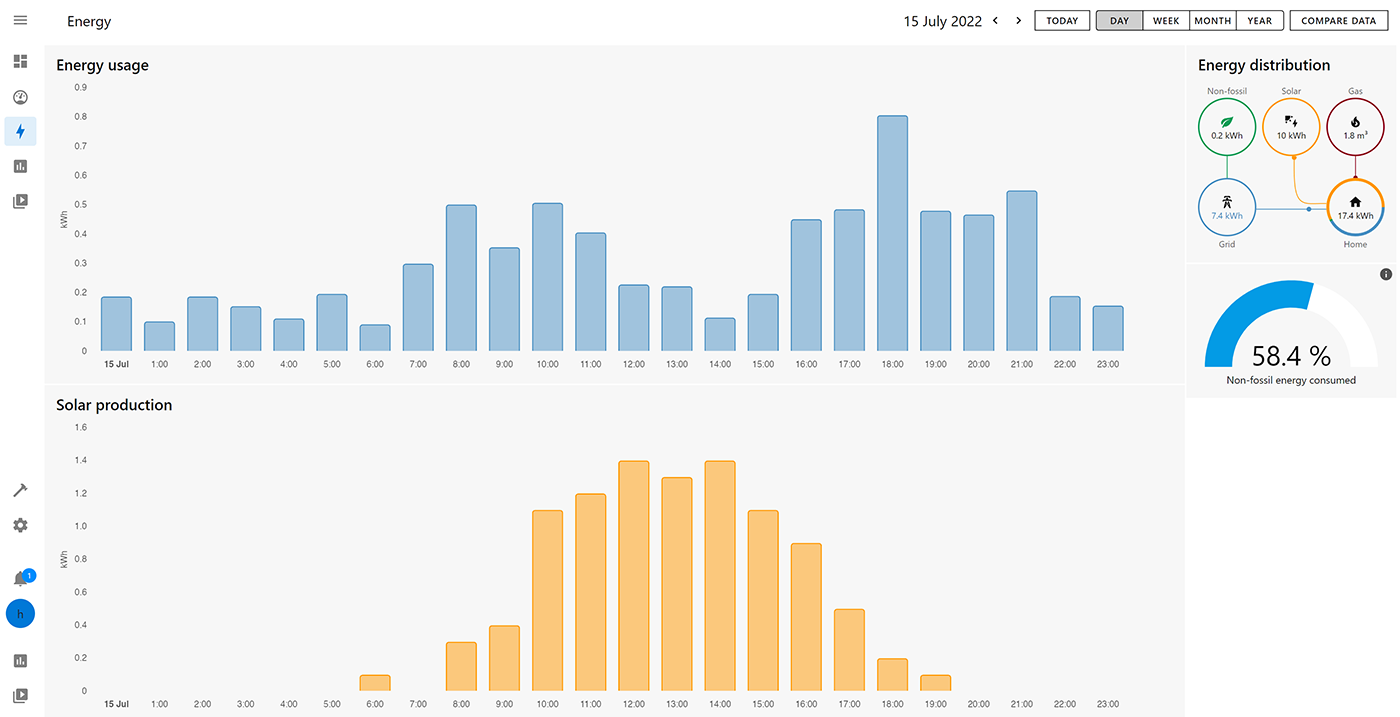
The old solar installation, which was 500W total, generated between 1.3 and 1.9 kWh per day (June 2022), and the new 1.65kW array is generating up to 10 kWh per day.
We have three panels below the chimneys, and the sun falls on these panels much earlier in the day compared to the old array. Where we still have two panels between the chimneys, they still have shadows over one panel early in the day.
The solar generation graph below shows an average July day with the panels starting to generate a small current at 6 am, but the energy doesn’t increase until the sun is on all five panels at 8 am.
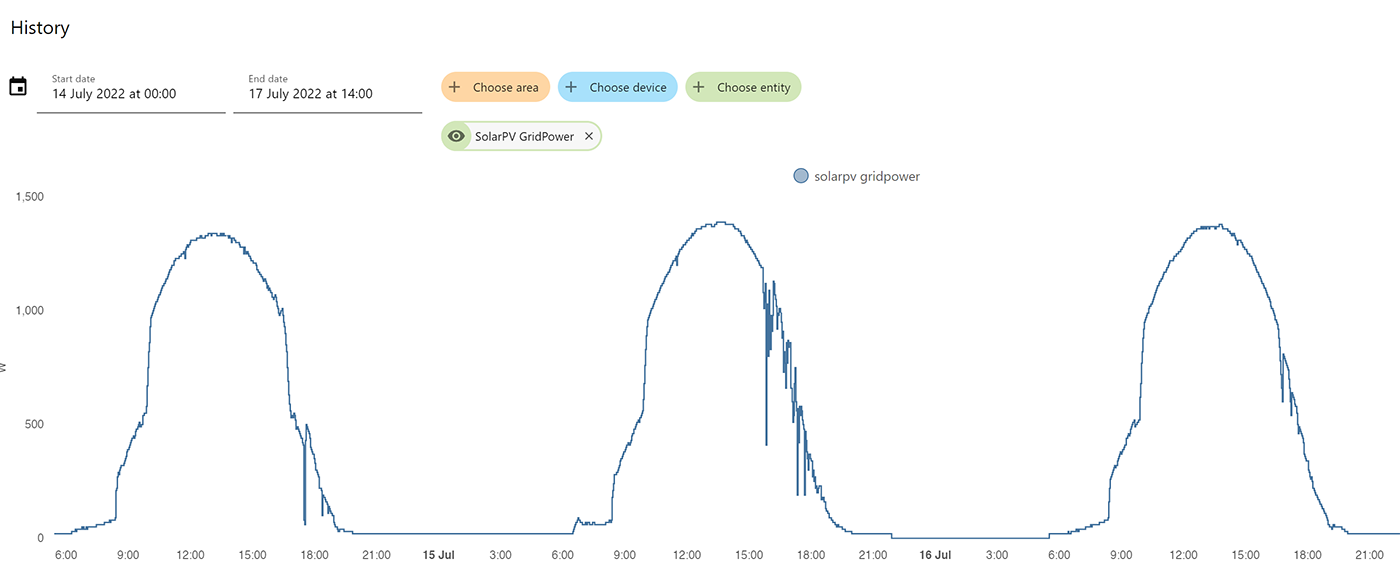
The current reaches 1000 watts around 10 am and stays above this value until mid-afternoon, when it slowly ramps down until 7 pm.
Ordering Solar PV Optimisers
The panels were initially installed without optimiser modules on the top two panels. After a few weeks of use, we ordered a pair of Tigo TS4 Add-On Optimised Modules from deep energy.
When we placed the order on the 10th of July, we selected the 1-day UPS delivery option, and after 3 days, we received an email saying the parcel was waiting for collection. I emailed the company several times over the following week to ask for updates, but they did not reply to any messages.
Eight days after we placed the order, we were told that the scaffolding was being removed and so we wouldn’t be able to fit the new optimisers. After receiving this news, I emailed Veep Energy, asking them to cancel the order as it had still not been sent. The following day I received an email telling me the order had been shipped!
As we cannot access the roof safely without scaffolding, we cannot fit the optimisers when they are delivered. With the cost of having new scaffolding erected being around £800, it is not viable to have it installed again to add the two optimisers.
Data Logging Updates
With the installation of the new solar PV inverter, we now had the total daily generation data available to store and use. I modified the online reporting site at home.briandorey.com to store and display the new information. This will be useful to compare our previous electricity usage and the new power generated from the roof over time.
Excess generation during July has been around 8 hours of the day and varies between 500 and 1000 watts. To make the most of this, we ordered a myenergi eddi, a solar PV diverter for the hot water cylinder. This will be delivered in August, and I will post it on the blog once it has been installed and running for a few weeks.
Hardware Costs
Excluding the cost of the scaffolding, which was included in the roofer bill, the total parts cost of this solar PV upgrade was £2641.70
The panels, inverter, mounting brackets and rails came to £2036, with the remaining items, such as fuses, cable, tools and conduit, making up the total.
If we had paid an installer to install a 1.6kW system, this would have cost over £4000, so we saved a lot of money by installing these ourselves.
Huge Energy Cost Increases
In July, our previous Electric and Gas supply contract was due to be renewed. We had previously been with E.ON Energy on a 24-month contract, and despite checking with all the other large energy suppliers in the UK, we couldn’t find any who would accept new customers at this time.
We had no choice but to renew with a new 24-month contract, but the prices have significantly increased for the energy prices and daily standing charges taking our monthly payments from around £140 per month to over £350.
The energy price cap in the United Kingdom is set to rise again in October 2022 and again in January 2023, so I don’t know what the next energy contract will cost next time.
| Service | Old kWh price | New kWh price | Change | Old Daily Charge | New Daily Charge | Change |
|---|---|---|---|---|---|---|
| Electric | 18.83 p/kWh | 41.03 p/kWh | 118% | 22.48 p/day | 43.39 p/day | 93% |
| Gas | 3.44 p/kWh | 10.52 p/kWh | 206% | 24.96 p/day | 27.22 p/day | 9% |
Based on previous years, the daily generation reduces by half in the winter months, so it should average around 7.5kWh per day, saving approx £3 per day or £1122 per year at current electricity rates.
The payback time should be two and a half years at this level.

Chas
Hi Brian, thanks for posting this. Did you need to contact the DNO / local electricity company first to do all this, if so how onerous was the process? I'm assuming the install isn't MCS-certified so therefore isn't eligible for FIT/SEG payments? Many thanks
Brian
Hi Chas
I emailed my DNO when I first had the system installed to notify them but never had any response from them so I assume they got the email and kept it somewhere!
As its a self install it isn't MCS-certified so i can not get any payments. Once we have the solar diverter for the hot water there wouldn't be any export back to the grid.
Chas
Hi again Brian, just wondering how things have worked out with your Eddi install (assuming it's happened!)
Best wishes
Brian
Hi Chas
It has been working well so far. I will do a blog post about it once it has been running for a few months. On a sunny day it heats the water tank over 55C